Production Grade Homelab #1: Seeing Everything

It started with a 3am incident I didn't know about until I woke up.
In early August, I expanded my Proxmox setup into a proper 2-node HA cluster — the previous post covers that. What it doesn't cover is what came after: a series of operational failures that I discovered hours late, by manually SSHing around and reading logs. The backup wrapper crashed nodes at 3am. A helper script wasn't deployed to the second node. Three containers sat stopped overnight. Every single one of these was invisible until I went looking.
If this were a work system, those failures would have pages. There would have been alerts, dashboards, escalations. But for my homelab? I was flying completely dark.
That's what this post is about fixing. This is the first entry in a new series — Production Grade Homelab — where I start treating my homelab infrastructure the same way I'd treat production at work. The three pillars: observability first, then Ansible for configuration management, then Terraform for provisioning. This post covers phase 1: getting full visibility.
The Stack
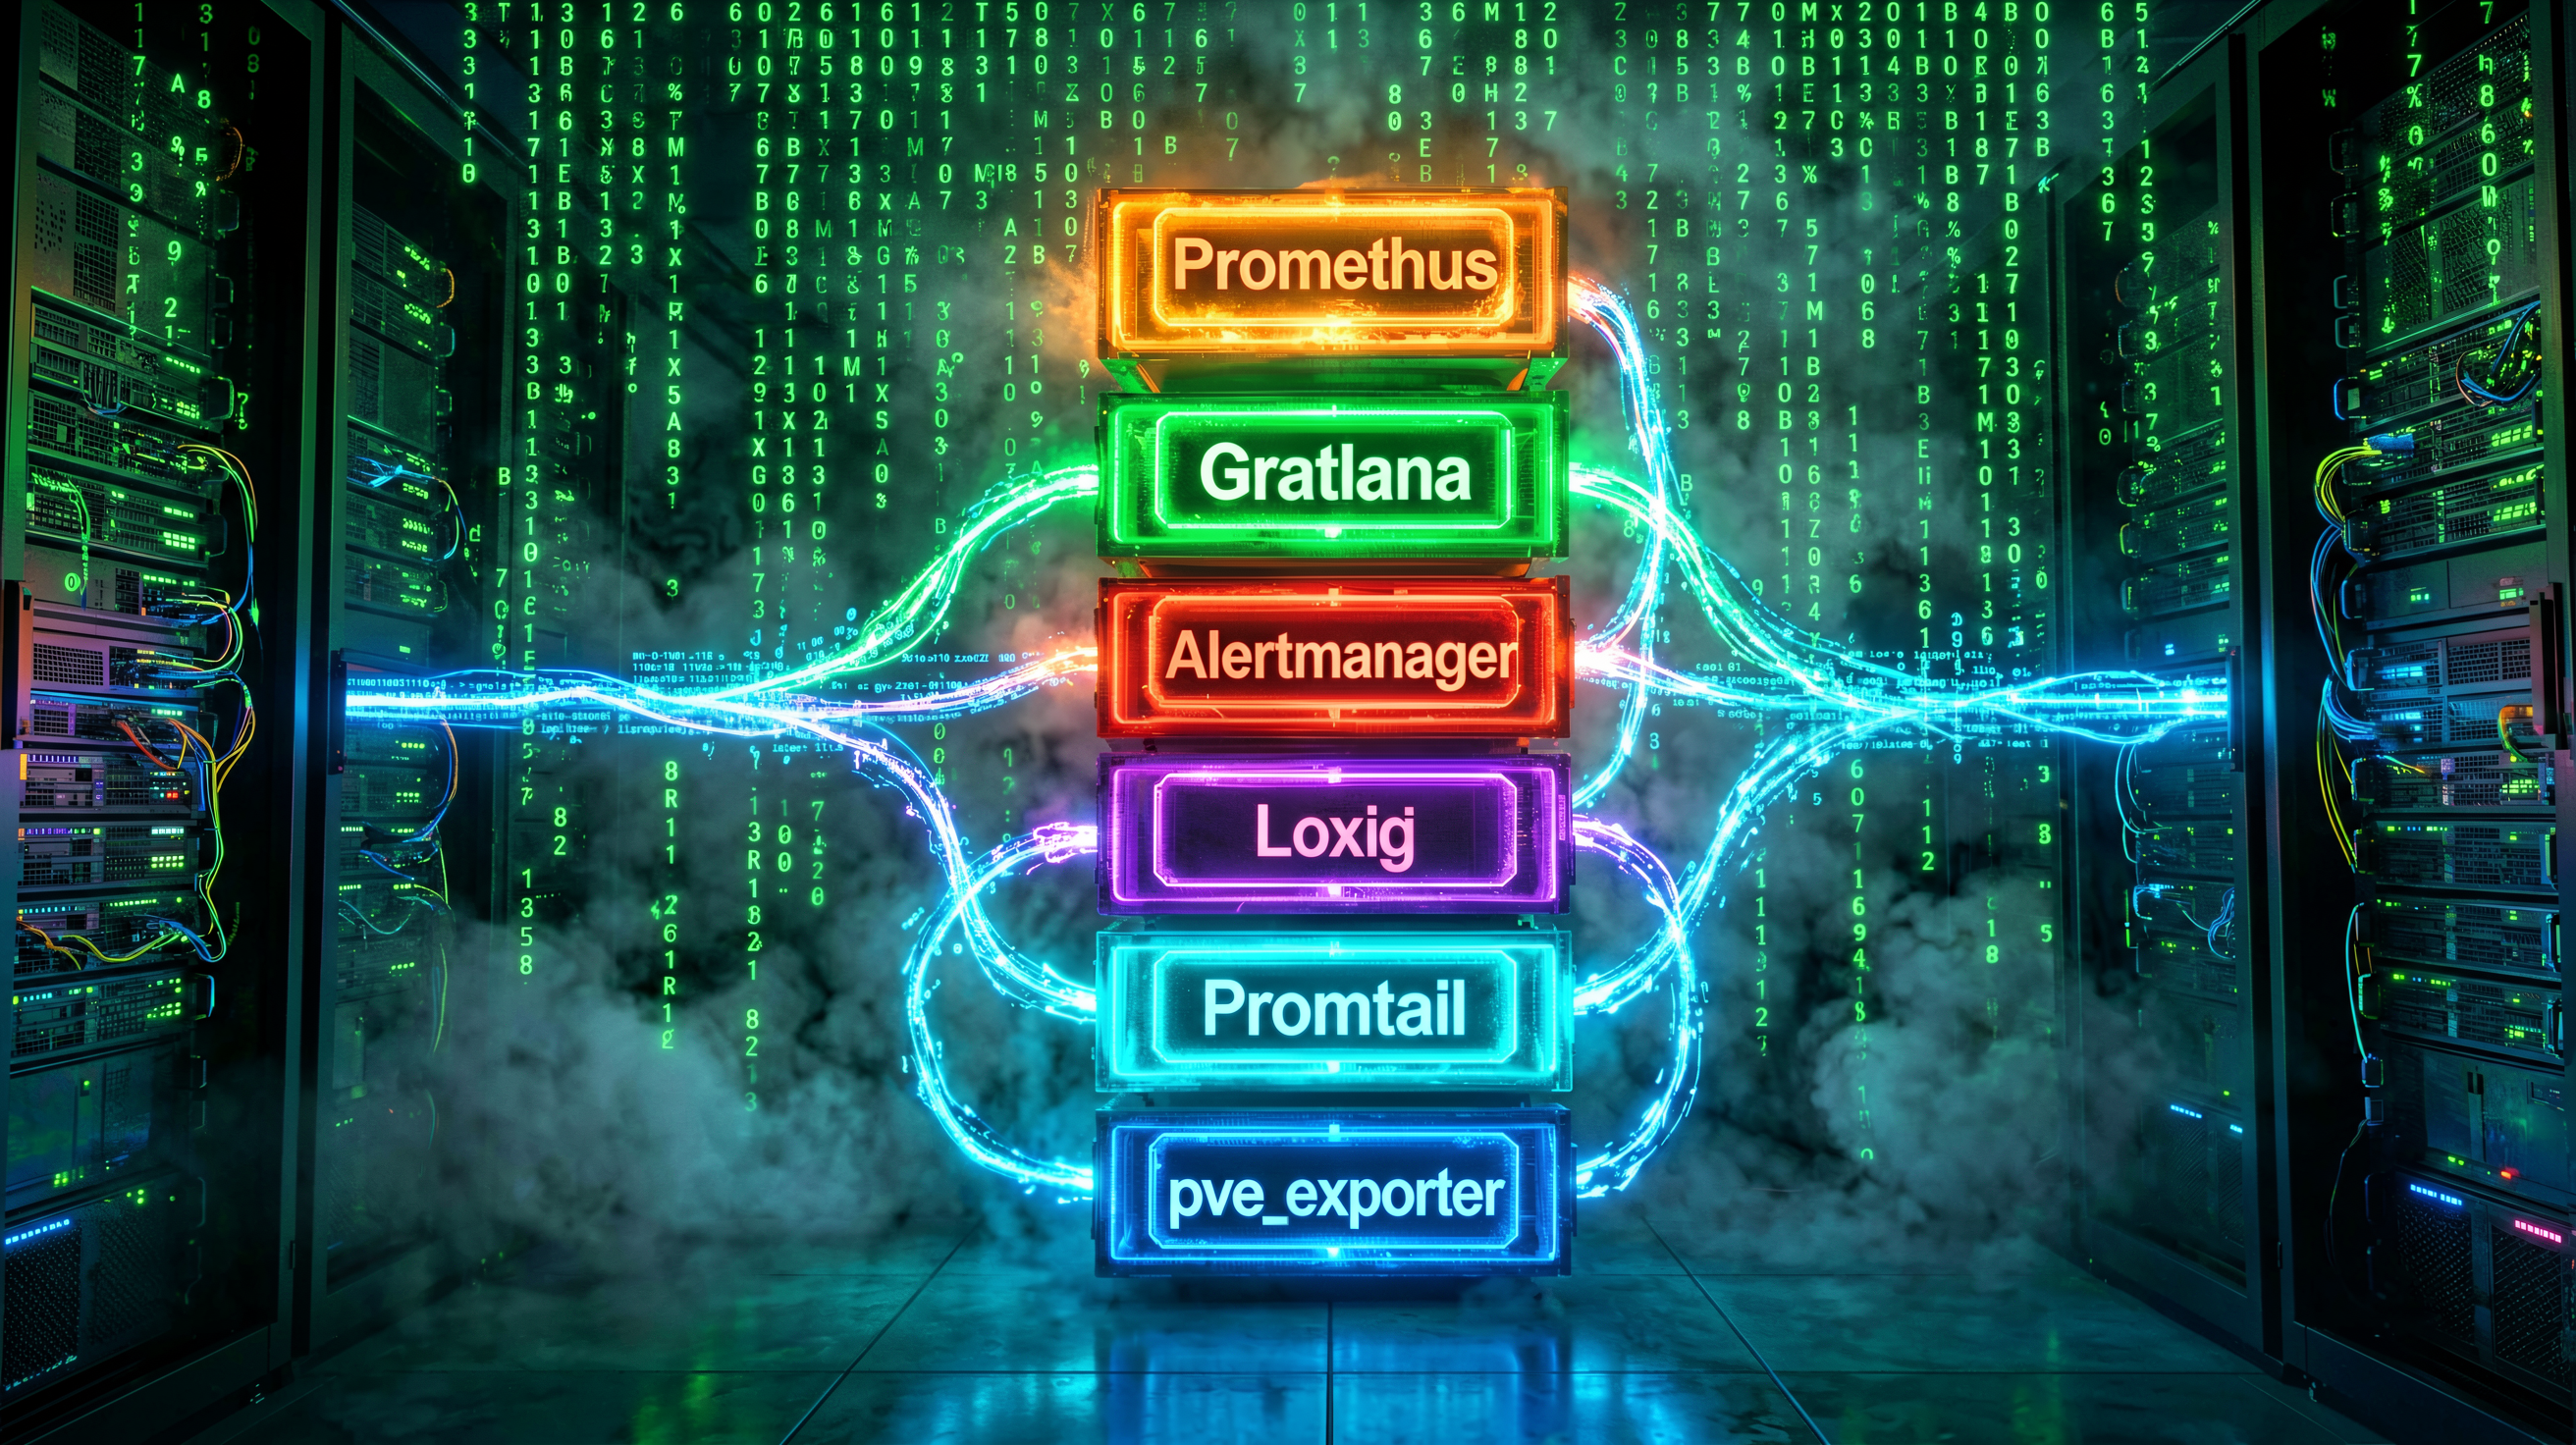
The goal was a single dedicated LXC that gives me:
- Prometheus — scraping metrics from every host in the lab
- Grafana — dashboards and a single pane of glass
- Alertmanager — routing critical alerts to Telegram immediately, warnings during business hours only
- Loki — log aggregation from all containers and hosts
- Promtail — log shipping from each host to Loki
- pve_exporter — Proxmox API metrics: HA state, guest status, storage
Everything runs as Docker containers on a single LXC (CT111) using a docker-compose.yml. The whole stack starts with one command.
CT111 — The Monitoring Container
Created as an unprivileged LXC on the primary Proxmox node, HA-enabled so it survives a node failure:
pct create 111 local:vztmpl/debian-12-standard_12.12-1_amd64.tar.zst \
  --hostname monitoring \
  --storage rpool \
  --rootfs rpool:60 \
  --cores 4 \
  --memory 4096 \
  --net0 name=eth0,bridge=vmbr0,ip=192.168.20.81/24,gw=192.168.20.1 \
  --nameserver 192.168.20.70 \
  --unprivileged 1 \
  --onboot 1 \
  --features nesting=1

pct start 111
ha-manager add ct:111 --state started
I gave it 60 GB of disk — 30 days of Prometheus metrics for 18 targets at 30s scrape interval uses about 4 GB, and Loki logs add another 3-4 GB/month. Plenty of headroom.
100.x.x.x). Rather than installing Tailscale inside CT111, I added a static route pointing the Tailscale CGNAT range (100.64.0.0/10) via the Proxmox host, which is already a Tailscale subnet router. Simple, clean, no extra daemon inside the container.
ip route add 100.64.0.0/10 via 192.168.20.99
The Compose Stack
All six services in one file at /opt/monitoring/docker-compose.yml:
services:
  prometheus:
    image: prom/prometheus:latest
    container_name: prometheus
    restart: unless-stopped
    ports: ["9090:9090"]
    volumes:
      - ./prometheus/prometheus.yml:/etc/prometheus/prometheus.yml:ro
      - ./prometheus/rules:/etc/prometheus/rules:ro
      - prometheus_data:/prometheus
    command:
      - '--config.file=/etc/prometheus/prometheus.yml'
      - '--storage.tsdb.path=/prometheus'
      - '--storage.tsdb.retention.time=30d'
      - '--web.enable-lifecycle'

  grafana:
    image: grafana/grafana:latest
    container_name: grafana
    restart: unless-stopped
    ports: ["3000:3000"]
    environment:
      - GF_AUTH_ANONYMOUS_ENABLED=true
      - GF_AUTH_ANONYMOUS_ORG_ROLE=Admin
      - GF_AUTH_DISABLE_LOGIN_FORM=true
      - GF_SERVER_ROOT_URL=https://monitoring.semesmieh.com
    volumes:
      - grafana_data:/var/lib/grafana
      - ./grafana/provisioning:/etc/grafana/provisioning:ro

  alertmanager:
    image: prom/alertmanager:latest
    container_name: alertmanager
    restart: unless-stopped
    ports: ["9093:9093"]
    volumes:
      - ./alertmanager/alertmanager.yml:/etc/alertmanager/alertmanager.yml:ro

  loki:
    image: grafana/loki:latest
    container_name: loki
    restart: unless-stopped
    ports: ["3100:3100"]
    volumes:
      - ./loki/loki-config.yml:/etc/loki/loki-config.yml:ro
      - loki_data:/loki
    command: -config.file=/etc/loki/loki-config.yml

  promtail:
    image: grafana/promtail:latest
    container_name: promtail
    restart: unless-stopped
    volumes:
      - /var/log:/var/log:ro
      - /var/run/docker.sock:/var/run/docker.sock:ro
      - ./promtail/promtail-config.yml:/etc/promtail/promtail-config.yml:ro
    command: -config.file=/etc/promtail/promtail-config.yml

  pve_exporter:
    image: prompve/prometheus-pve-exporter:latest
    container_name: pve_exporter
    restart: unless-stopped
    ports: ["9221:9221"]
    volumes:
      - ./pve_exporter/pve.yml:/etc/prometheus/pve.yml:ro

volumes:
  prometheus_data:
  grafana_data:
  loki_data:
A few things worth noting about this config:
- Grafana anonymous access — this is LAN-only (no Cloudflare Tunnel), so I turned off the login form entirely. No password prompts on an internal-only dashboard.
- Promtail mounts the Docker socket — so it can discover and tail container logs automatically. Every container that starts gets picked up within 5 seconds.
- pve_exporter config path — the container expects
/etc/prometheus/pve.yml, not/etc/pve.yml. Caught that one the hard way.
Scraping 18 Targets
node_exporter gets deployed to every host. For standard Debian/Ubuntu systems it's a binary + systemd service:
wget -q https://github.com/prometheus/node_exporter/releases/download/v1.8.2/node_exporter-1.8.2.linux-amd64.tar.gz
tar xzf node_exporter-1.8.2.linux-amd64.tar.gz
cp node_exporter-1.8.2.linux-amd64/node_exporter /usr/local/bin/
useradd -rs /bin/false node_exporter

cat > /etc/systemd/system/node_exporter.service << 'EOF'
[Unit]
Description=Node Exporter
After=network.target

[Service]
User=node_exporter
ExecStart=/usr/local/bin/node_exporter --collector.systemd --collector.processes
Restart=always

[Install]
WantedBy=multi-user.target
EOF

systemctl daemon-reload && systemctl enable --now node_exporterExec format error. Always check uname -m on your target before downloading.
For Unraid, which uses a non-standard OS without systemd services in the usual sense, Docker is cleaner:
docker run -d --name node_exporter --restart unless-stopped \
  --net=host --pid=host \
  prom/node-exporter:latest
The Prometheus scrape config covers all 14 node_exporter targets plus the pve_exporter scraping both Proxmox nodes:
scrape_configs:
  - job_name: 'node_exporter'
    static_configs:
      - targets:
          - '192.168.20.99:9100'   # pve
          - '192.168.20.97:9100'   # pve2
          - '192.168.20.69:9100'   # hermes-vm
          - '192.168.20.200:9100'  # unraid
          - '100.126.123.7:9100'   # jarvis (via Tailscale route)
          - '192.168.20.70:9100'   # CT101 adguard
          # ... all 14 hosts

  - job_name: 'pve_exporter'
    metrics_path: /pve
    params:
      module: [default]
    static_configs:
      - targets: ['192.168.20.99', '192.168.20.97']
    relabel_configs:
      - source_labels: [__address__]
        target_label: __param_target
      - source_labels: [__param_target]
        target_label: instance
      - target_label: __address__
        replacement: pve_exporter:9221
End result: 18/18 targets green on first try after deploying to all hosts.
Alerting — What Fires and When

The alert rules cover the things that actually caused pain in August, plus the obvious operational concerns:
| Alert | Condition | Severity |
|---|---|---|
HostDown | node_exporter unreachable >2min | Critical |
ProxmoxGuestDown | CT or VM offline >3min | Critical |
DiskSpaceCritical | Any mount <5% free | Critical |
BackupMissed | No PBS backup in >48h | Critical |
TelegramBotWorkflowFailed | n8n workflow fails | Critical |
TelegramBotDown | n8n unreachable >2min | Critical |
DiskSpaceWarning | Any mount <15% free | Warning |
HighMemoryUsage | RAM <10% free >5min | Warning |
HighCPUUsage | CPU >90% for 10min | Warning |
ZFSPoolWarning | ZFS pool >80% full | Warning |
DiskTempHigh | Disk temp >60°C | Warning |
Routing in Alertmanager separates critical and warning delivery:
time_intervals:
  - name: business_hours
    time_intervals:
      - times:
          - start_time: '09:00'
            end_time: '23:00'
        location: 'Australia/Sydney'

route:
  receiver: 'telegram-critical'
  routes:
    - matchers: [severity = critical]
      receiver: 'telegram-critical'
      repeat_interval: 1h
    - matchers: [severity = warning]
      receiver: 'telegram-warning'
      active_time_intervals: [business_hours]
      repeat_interval: 6h
Critical alerts fire immediately, 24/7. Warnings are silenced overnight (11pm–9am Sydney time) so a disk temp spike at 2am doesn't wake anyone up. The repeat intervals prevent alert storms — critical fires every hour, warnings every 6 hours if the condition persists.
pve_exporter exposes guest state via pve_up{id="lxc/101"} — the label is id, not type. The commonly-seen pve_up{type=~"lxc|qemu"} returns zero results because there is no type label in this exporter version. The correct expression is:
pve_up{id=~"lxc/.*|qemu/.*"} == 0
n8n Metrics for Bot Failure Alerts
The Telegram download bot runs on CT105 (n8n + yt-dlp). I wanted an alert when a workflow fails — not just when the container is down, but when a download silently errors. n8n has a built-in Prometheus metrics endpoint, you just need to enable it:
# In the n8n service environment variables:
- N8N_METRICS=true
- N8N_METRICS_PREFIX=n8n_
- N8N_METRICS_INCLUDE_WORKFLOW_ID_LABEL=true
Then add it as a Prometheus scrape target and write an alert on the failure counter:
- alert: TelegramBotWorkflowFailed
  expr: increase(n8n_workflow_execution_duration_seconds_count{status="failed"}[5m]) > 0
  for: 0m
  labels:
    severity: critical
  annotations:
    summary: "Telegram bot workflow failed"
    description: "n8n workflow failed — download likely broken"
Log Aggregation with Loki
Loki runs alongside Prometheus and Grafana in the same compose stack. Promtail ships logs from CT111 itself — both system logs and Docker container logs via the Docker socket discovery feature:
scrape_configs:
  - job_name: varlogs
    static_configs:
      - targets: [localhost]
        labels:
          job: varlogs
          host: monitoring
          __path__: /var/log/**/*.log

  - job_name: docker
    docker_sd_configs:
      - host: unix:///var/run/docker.sock
        refresh_interval: 5s
    relabel_configs:
      - source_labels: [__meta_docker_container_name]
        regex: /(.*)
        target_label: container
      - target_label: host
        replacement: monitoring
      - target_label: job
        replacement: docker
The Docker SD config automatically discovers every container and streams its logs. In Grafana's Explore view, you can query {container="alertmanager"} to see exactly what Alertmanager was doing when a delivery failed — or {job="docker"} to see everything at once.
curl localhost:3100/ready returns "Ingester not ready: waiting for 15s after being ready" for about 20 seconds before returning ready. This is normal — it's not an error. Don't mistake the startup message for a crash loop.
Phase 2 (Ansible) will deploy Promtail to every other host in the lab, so logs from pve, pve2, CT103 (Jellyfin/Plex), CT107 (arr-stack) and the rest all flow into the same Loki instance.
The Homelab Overview Dashboard

Rather than just importing community dashboards (though I did that too — Node Exporter Full ID 1860 is excellent), I built a custom overview dashboard that gives the full homelab picture at a glance:
- Active Alerts row — live firing/pending alerts, always at the top
- Nodes row — CPU % and RAM % stat tiles for pve, pve2, Unraid, Hermes VM — color coded green/yellow/red
- HA Guests table — every CT and VM with UP/DOWN status pulled from pve_exporter, color-coded
- Storage row — disk fill gauges for pve rpool, pve2 rpool, Unraid cache SSD, CT111
- Network row — time-series charts for in/out across pve, pve2, Unraid
- Recent Logs row — live container log stream at the bottom
The dashboard auto-refreshes every 30 seconds and is set as the Grafana home page. Open monitoring.semesmieh.com and everything is right there.
What This Catches That I Was Missing
The first real test came immediately. Within minutes of the rules loading, two things fired:
- DiskTempHigh — several hosts were sitting above 45°C. Not a problem (I raised the threshold to 60°C after seeing the noise), but I genuinely didn't know those temperatures without digging into individual SMART data.
- ProxmoxGuestDown for qemu/104 — the Windows 11 VM I'd just created and stopped. Expected, silenced it.
More importantly: if the August incident (CT103/105/107 left stopped overnight after the backup wrapper bug) happened today, I'd get a Telegram message within 3 minutes. Not the next morning.
What's Next
Phase 2 is Ansible. The monitoring stack is now the motivation: I want ansible-playbook site.yml to enforce known-good state across every host — the same way Prometheus now shows me when that state drifts. Promtail deployed to all hosts, helper scripts enforced on both PVE nodes, Caddy and AdGuard managed as templates.
After that, Terraform for new resource provisioning. The whole series:
- Phase 1 — Observability ✅ (this post)
- Phase 2 — Ansible: codifying existing configuration
- Phase 3 — Terraform: declarative resource provisioning
- Phase 4 — Importing existing infrastructure into Terraform state
docker compose up -d. Prometheus scraping 18 targets, Grafana with a custom homelab dashboard, Alertmanager routing to Telegram with business-hours silencing for warnings, Loki ingesting Docker container logs from day one. The hardest part wasn't the tooling — it was accepting that the homelab deserves the same visibility as production.